Kaggleでよく使われるLightGBMやXGBoostといった勾配ブースティング木ですが、TensorFlow 2.0にブースティング木のパッケージが実装されて手軽にブースティング木による分類や回帰を実行することができます。今回は「Google Colaboratory」で、TensorFlowのタイタニックのデータセットを使って試してみました。(以下のツイートのページには英語で詳しく書かれてます。)
まず、インストール。
!pip install tensorflow==2.0.0-alpha0
import numpy as np
import pandas as pd
import tensorflow as tf
tf.random.set_seed(0)
print(tf.__version__)
タイタニックのデータセットを読み込む。
dftrain = pd.read_csv('https://storage.googleapis.com/tf-datasets/titanic/train.csv')
dfeval = pd.read_csv('https://storage.googleapis.com/tf-datasets/titanic/eval.csv')
y_train = dftrain.pop('survived')
y_eval = dfeval.pop('survived')
特徴量をカテゴリー変数と数値に分けてる。カテゴリー変数はOne-hot Encodingへ。
fc = tf.feature_column
CATEGORICAL_COLUMNS = ['sex', 'n_siblings_spouses', 'parch', 'class', 'deck', 'embark_town', 'alone']
NUMERIC_COLUMNS = ['age', 'fare']
def one_hot_cat_column(feature_name, vocab):
return fc.indicator_column(
fc.categorical_column_with_vocabulary_list(feature_name,vocab))
feature_columns = []
for feature_name in CATEGORICAL_COLUMNS:
vocabulary = dftrain[feature_name].unique()
feature_columns.append(one_hot_cat_column(feature_name, vocabulary))
for feature_name in NUMERIC_COLUMNS:
feature_columns.append(fc.numeric_column(feature_name,dtype=tf.float32))
入力するときの関数作るの慣れてない…。ここがscikit-learnとは違うところ。
NUM_EXAMPLES = len(y_train)
def make_input_fn(X, y, n_epochs=None, shuffle=True):
def input_fn():
dataset = tf.data.Dataset.from_tensor_slices((dict(X), y))
if shuffle:
dataset = dataset.shuffle(NUM_EXAMPLES)
dataset = dataset.repeat(n_epochs)
dataset = dataset.batch(NUM_EXAMPLES)
return dataset
return input_fn
train_input_fn = make_input_fn(dftrain, y_train)
eval_input_fn = make_input_fn(dfeval, y_eval, shuffle=False, n_epochs=1)
後は、パラメータ設定して動かすだけ!
params = {
"n_trees": 50,
"max_depth": 3,
"n_batches_per_layer": 1,
"center_bias": True
}
est = tf.estimator.BoostedTreesClassifier(feature_columns, **params)
est.train(train_input_fn, max_steps=100)
result = est.evaluate(eval_input_fn)
print(pd.Series(result))
結果として以下のものが出力されます。
accuracy                  0.803030
accuracy_baseline         0.625000
auc                       0.862504
auc_precision_recall      0.836979
average_loss              0.424687
global_step             100.000000
label/mean                0.375000
loss                      0.424687
precision                 0.752688
prediction/mean           0.387544
recall                    0.707071
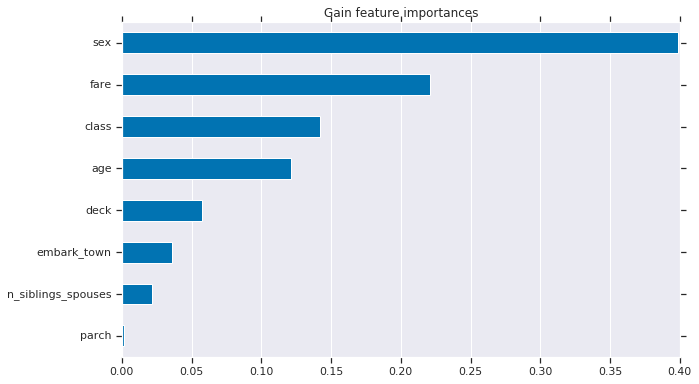
特徴量の寄与度を可視化する。
import matplotlib.pyplot as plt
import seaborn as sns
sns_colors = sns.color_palette("colorblind")

importances = est.experimental_feature_importances(normalize=True)
df_imp = pd.Series(importances)

N = 8
ax = (df_imp.iloc[0:N][::-1].plot(kind='barh',color=sns_colors[0],title='feature importances',figsize=(10, 6)))
ax.grid(False, axis='y')
よく見かける特徴量の重要度を可視化したものが表示されます。

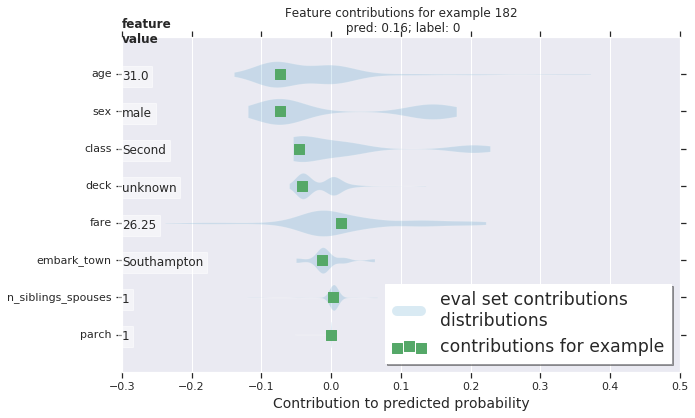
GitHubのチュートリアルページには各サンプル、今回の場合は人ごとに特徴量の寄与度を表示させていて勉強になりました。面白い。これは別にTensorFlowに限った話ではないみたいで、scikit-learnでもできるらしい。知らなかった…。何千、何万ものデータを扱っていたらひとつひとつ見ていくことはできないと思うので、どういう時にこれは使うのかなとは思いました。

GitHubのチュートリアルページ(プロット図はここから引用)
https://github.com/tensorflow/docs/blob/master/site/en/r2/tutorials/estimators/boosted_trees_model_understanding.ipynb
TensorFlowのドキュメントhttps://www.tensorflow.org/versions/r2.0/api_docs/python/tf/estimator/BoostedTreesClassifier

